Shift Analysis with Timecards 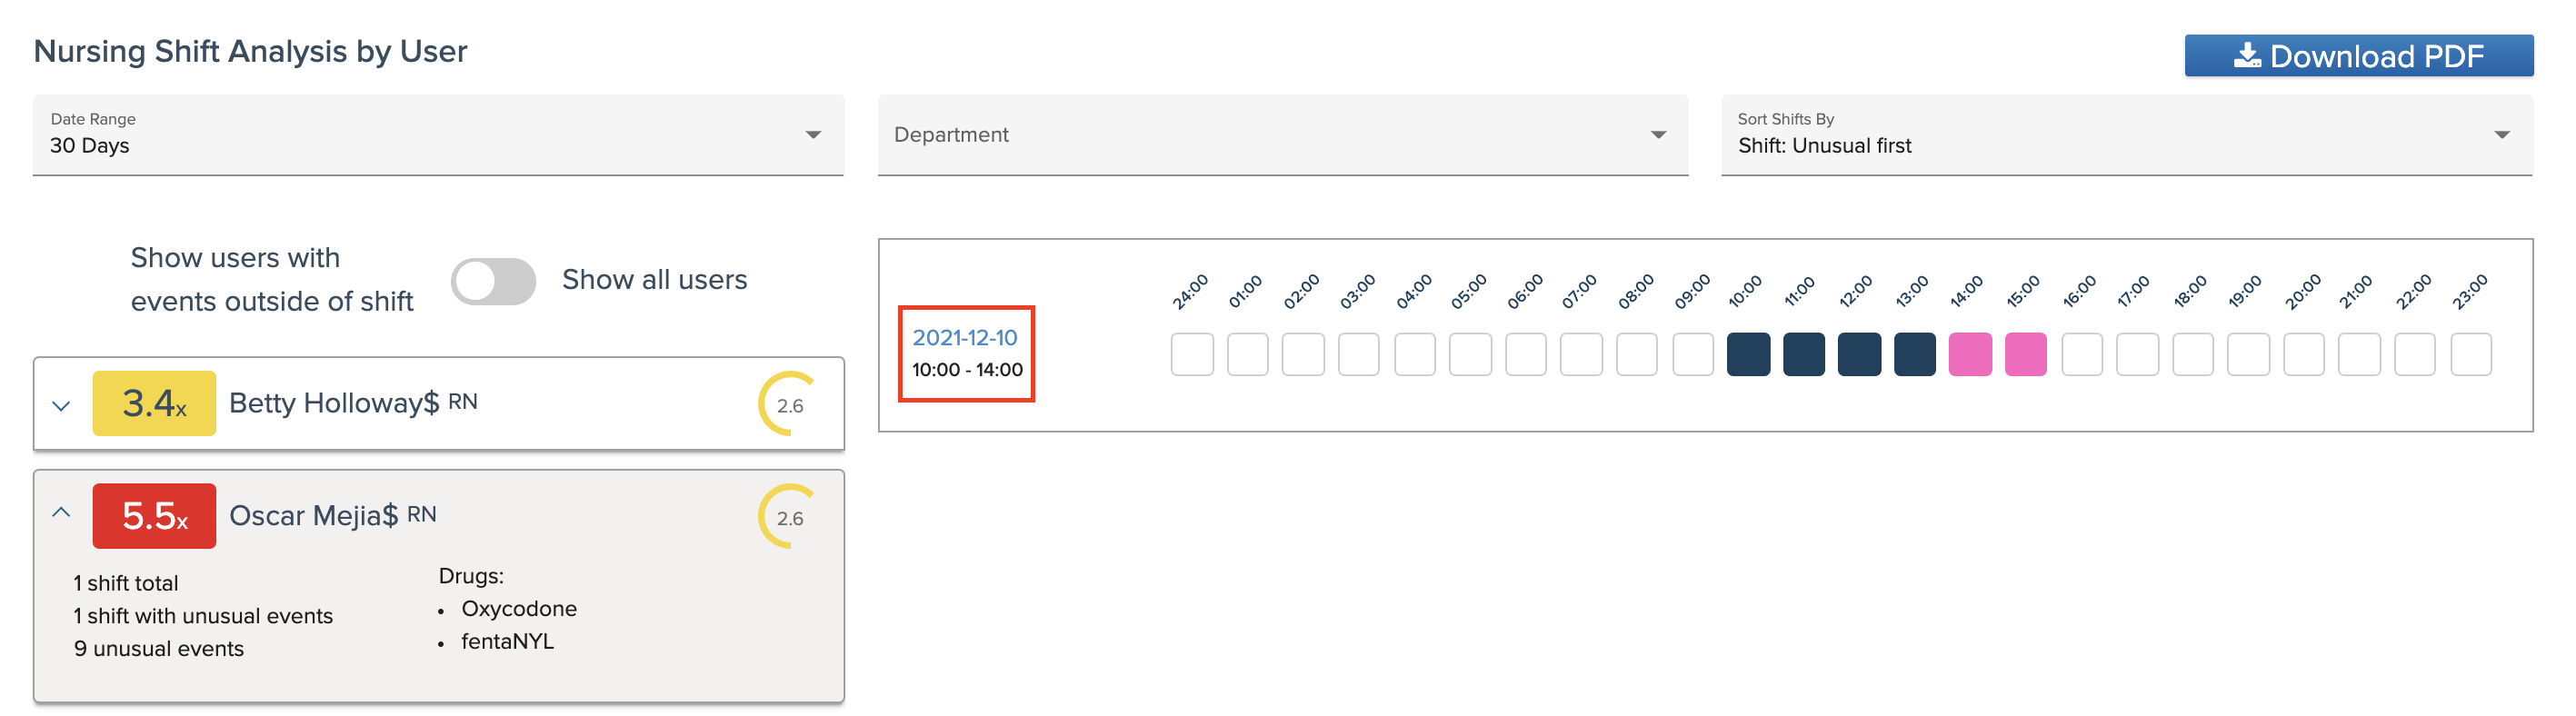
The Shift Analysis metric has been a long-standing metric in IRIS; however, we are in the process of launching a second version of the metric: Shift Analysis with Timecards. Currently, in Beta, this version utilizes time and attendance data from your facility's timekeeping software and compares it to controlled substance event data.
Our goal is to detect and prevent future drug diversion by monitoring provider activity before and after their scheduled work shifts. By integrating the attendance data with ControlCheck we can identify "unusual" events that occur outside of scheduled shifts. There is, however, a 1-minute buffer between the clock-in or clock-out time where events that occur within this short period are deemed exempt from the "unusual" label.
What makes an event unusual?
In order for an event to qualify as "unusual", all of the following must be true:
- The event must be a dispense, admin, waste, or return.
- The event must be for an audited medication and not all audited medications are DEA-controlled substances. All of your hospital's audited medications, regardless of controlled status, will be included in the audit report.
- The event must be more than 1-minute before the reported clock-in time or more than 1-minute after the reported clock-out time.
- The event must be associated with a shift. ControlCheck must receive click in/out data for providers to evaluate if a transaction is unusual or expected.
New Shift Analysis Score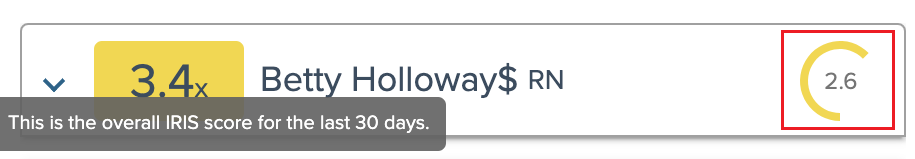
Another major difference between the first and second versions of the Shift Analysis metric is that the second version assigns a Shift Analysis Score to providers. The Shift Analysis score is located to the right of the provider card, while the IRIS score is found on the left. The data from this metric is also included in a provider's IRIS, whereas in the first version, it isn't.
Note: Canceled events outside of shift times are not currently tracked.
The Shift Analysis Calendar

The Shift Analysis Calendar highlights providers who are creating events outside of their shift window. However, a 1-minute buffer is included where ControlCheck does not count events as unusual if they were created within 1 minute of the clock-in or clock-out time. Each box within the calendar represents a one-hour block and the blocks are further color-coded to represent the following:
Dark Blue - There are events in this one-hour block, but 0 unusual events.
Pink - There are events that have been flagged as "unusual".
White with a Gray outline - This one-hour block is outside of the shift times and does not contain any events, usual or unusual.
Examining an Unusual Event
You can click on unusual events to open the Investigate Data by User screen for only that time block and run the Shift Analysis by User report.
Click on the shift's date link (e.g., 2022-04-16) or a "pink" block to open the Investigate Data by User page and view a summary of all the unusual events for that day.

You can examine events details with Investigate Shift Analysis by User feature to drill down deeper into unusual events that are flagged outside of a provider's scheduled shift.
The Investigate Data page for the selected user and their associated shift analysis data displays all the unusual events that occurred for the selected time or for the entire day, depending on what you selected from the Shift Analysis Calendar. 
Expanding Event Summary Cards
When expanding an Event Summary Card, the layout will be similar to patient cards displayed on the Audit Table; however, there are some key differences to note.
- You can add notes via the "Add Notes" button and review them within the "Notes" tab.
- You can email colleagues a copy of the information displayed within the Event Summary Card.
- You can review the provider's IRIS and navigate to the IRIS dashboard for an in-depth review.
- You cannot change the status of the event summary.
- You cannot you assign a collaborator despite seeing the icon as it is inactive.

To access this page:
- Select View User Analytics from the Analyze drop-down in the top navigation header.
- Select the Shift Analysis metric.
- Select a user from the User Selection Panel.
- In the Shift Analysis Calendar, click on the unusual event (pink) or date that you want to examine.
- Select the desired Event Summary Card to expand it and review the event data.
- Select the IRIS tab to review the provider's IRIS information.
- Select the "Go to IRIS Dashboard" link to review the provider's Detailed Risk Score Analysis Data within the IRIS Dashboard. (Optional)

Read More About Shift Analysis (Version 2)
Please read the following knowledge base articles to widen your knowledge of this metric.
Join Our Beta Program
This feature is currently in Beta and in the future will only be available upon request. To join our Beta program please reach out to your facility's designated Account Manager.
Additional Training Resources
You can learn more about the Shift Analysis (Version 2) metric by taking our Analytics in ControlCheck eLearning course series located within the Bluesight Community's Learning Library folder.
Was this article helpful?
That’s Great!
Thank you for your feedback
Sorry! We couldn't be helpful
Thank you for your feedback
Feedback sent
We appreciate your effort and will try to fix the article