Med Trends
The Med Trends metric dashboard highlights trends in medication usage and handling across individual nursing team members. The dashboard allows the user to trace a clinician's dispense, administration, waste, and return patterns across a medication, and compare rates within the larger cohort or within a specific department to identify outliers. ControlCheck users can use the application's display to narrow down areas of greater risk and focus investigative energies.
Access the Dashboard
Navigate to the Analytics tab in the main dashboard menu and select User Analytics in the dropdown menu. This will forward you to the IRIS Dashboard where you can then select the Med Trends Metric link to view its dashboard.
Filters
The Med Trends metric dashboard allows for the following filters:
- Start Date - allows you to select a start date for your data
- End Date - allows you to select an end date for your data
- Department
- User
- User Role
- Standard Deviation
- None; +1, +2, +3, +4 standard deviations from the norm
The default date range for all dashboards is the previous 30 days. Selecting a standard deviation filter will filter the results to show only data that is equal to or greater than the threshold selected
Interact with the Dashboard
There are two tabs within the Med Trends dashboard:
- Tabular Data - This will display the Med Trends data in a table layout
- Visualized Data - This will display the Med Trends data in a bar graph
To toggle between each tab, select the corresponding icon at the top of the dashboard.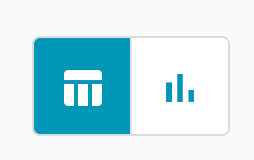
Tabular Data View
By default, the results will be filtered to show only the top 25 nursing team members. The results are ranked by the highest average of the medication trends for that user.
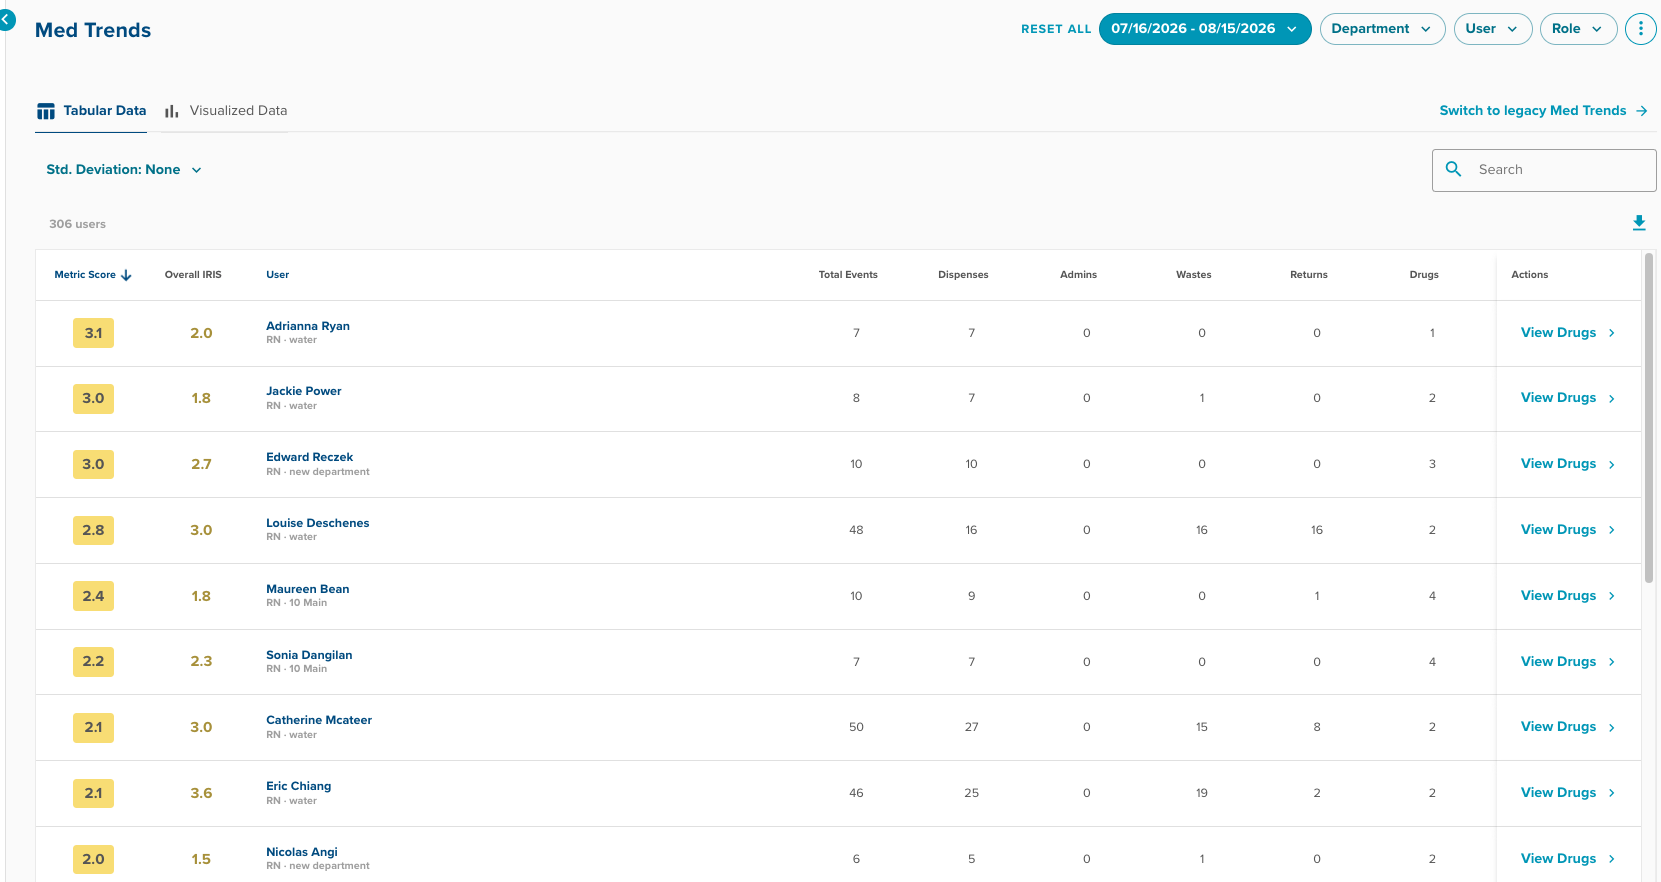
For each user, the following data items will display in the table:
- Metric Score - This includes the user's Med Trends Metric Score
- Overall IRIS - This includes the user's overall IRIS score
- User - This will include the user's name, department and role
- Total Events - This will display the total number of events for that user during the selected time period
- Dispenses - This will display the total number of dispense events during the selected time period
- Admins - This will display the total number of administration events during the selected time period
- Wastes - This will display the total number of waste events during the selected time period
- Returns - This will display the total number of return events during the selected time period
- Drugs - This will display the medications associated with the transactions for that provider
Visualized Data View
The Visualized Data view will display the Med Trends in a bar graph, allowing you to easily review and compare users' medication transactions and handlings.
Investigate the Data
To view the specific, detailed events included in a clinician's results for a medication and transaction type, first select the specific clinician for analysis by selecting their bar in the table.
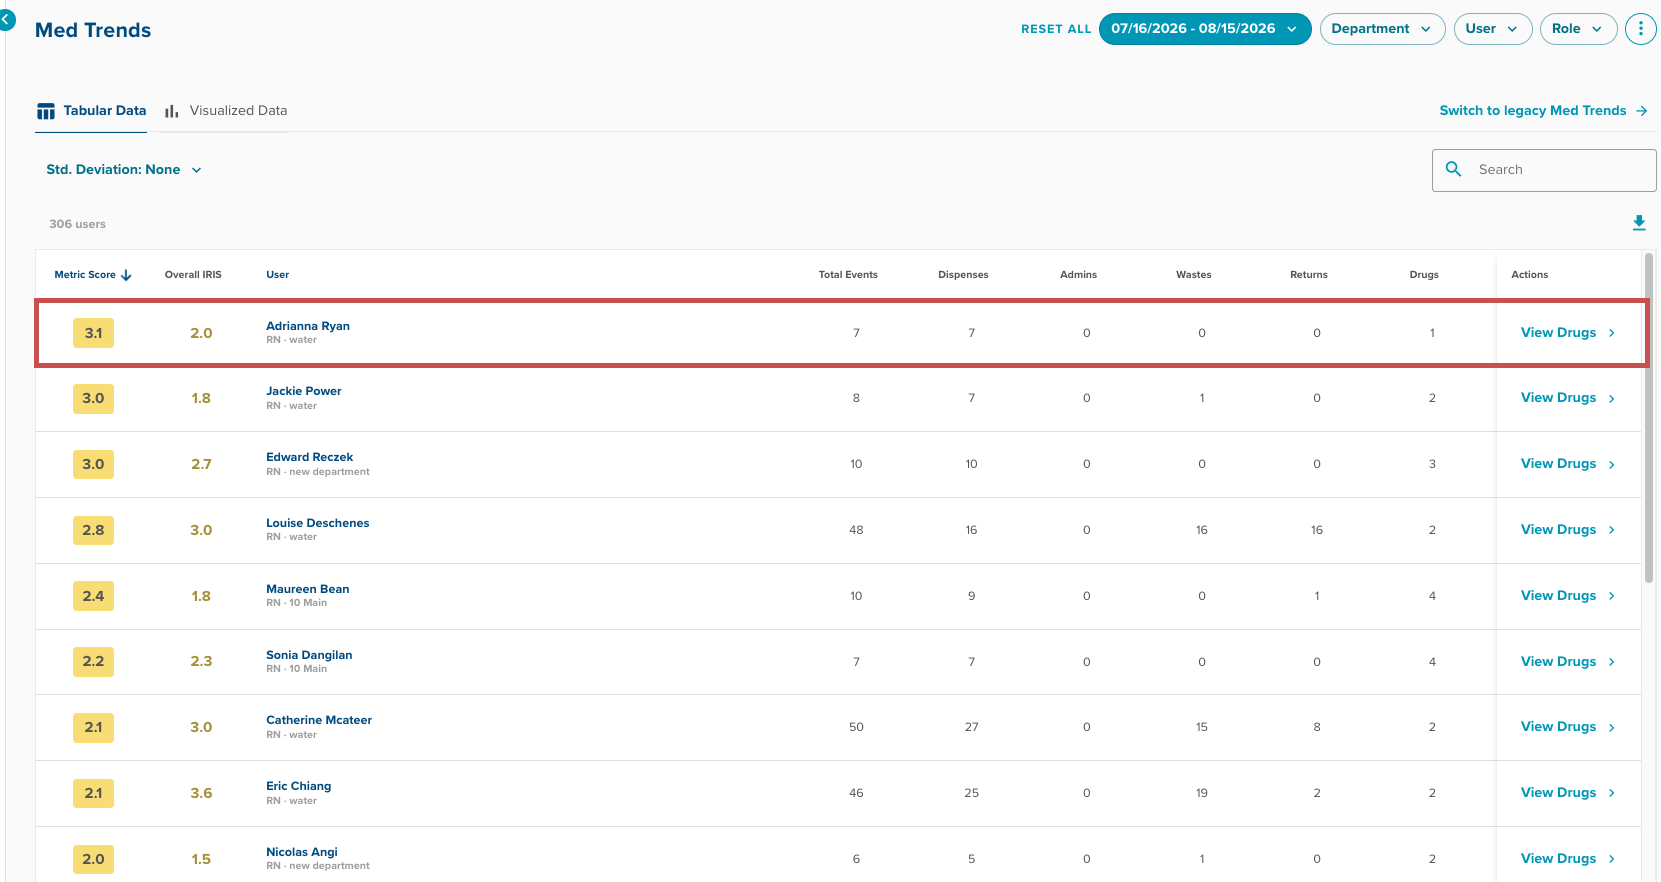
Once a provider is selected, their corresponding med trends dashboard will appear, displaying the medication details for the provider.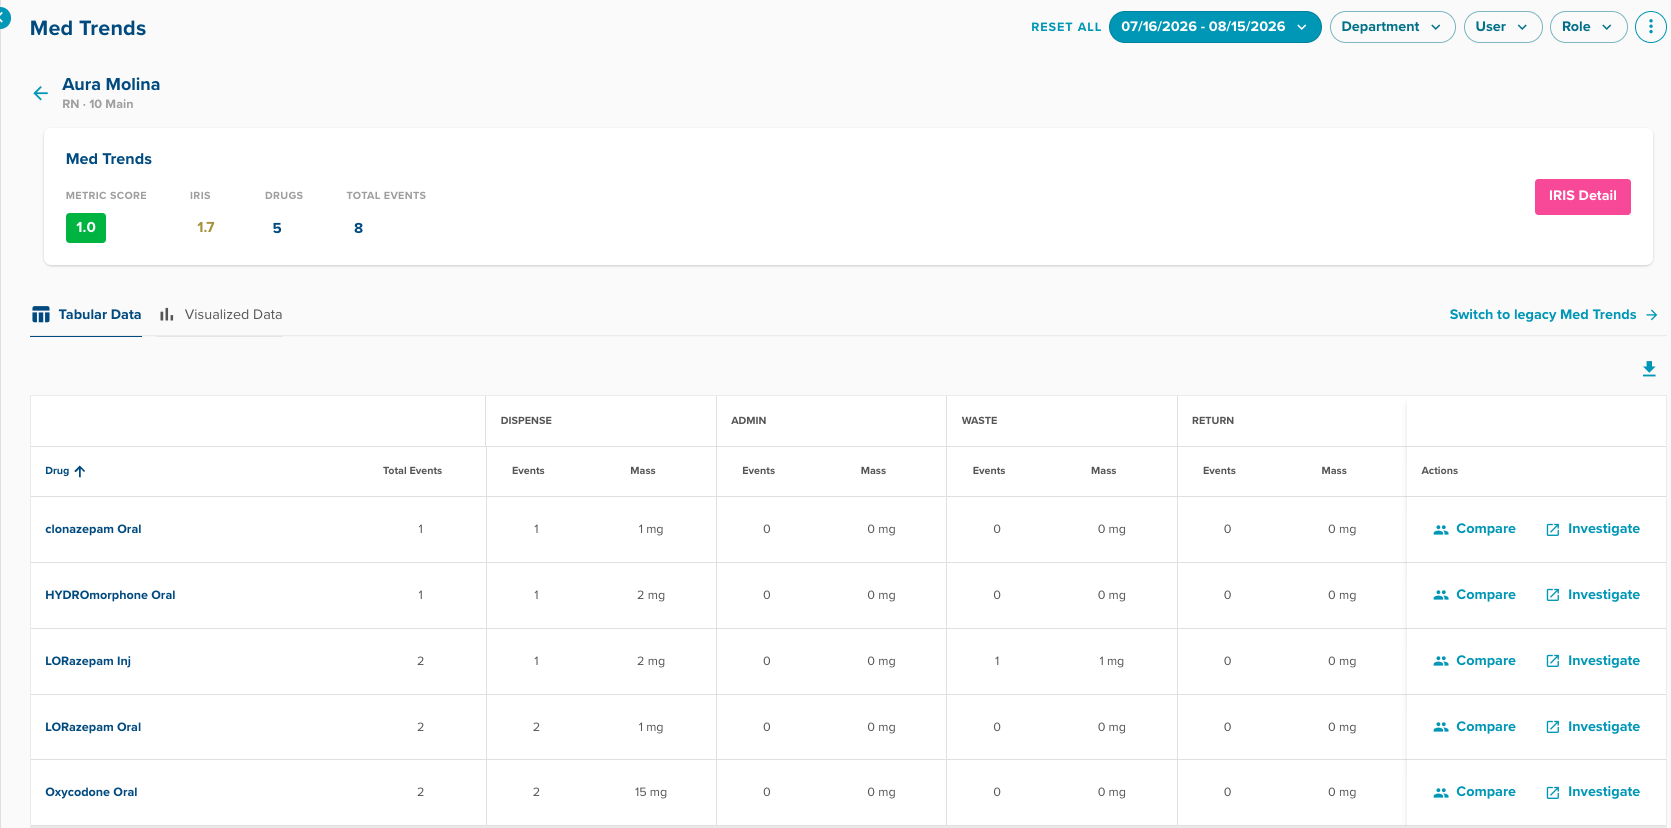
After reviewing the data in the table below, there are two ways to continue investigating the data.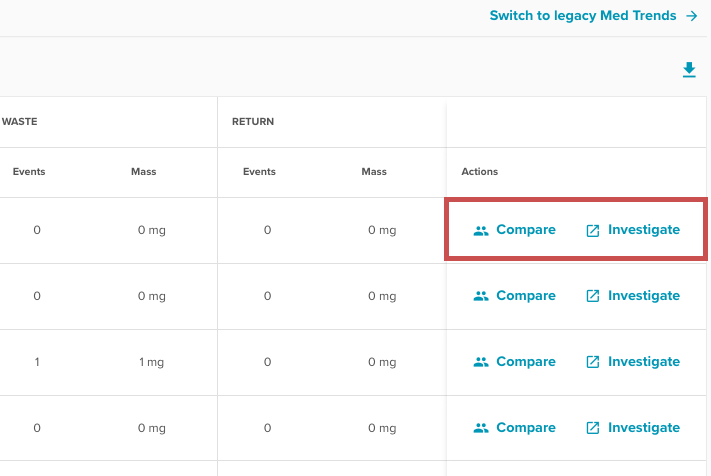
The Compare button allows you to compare the provider's activity for that medication with other users.
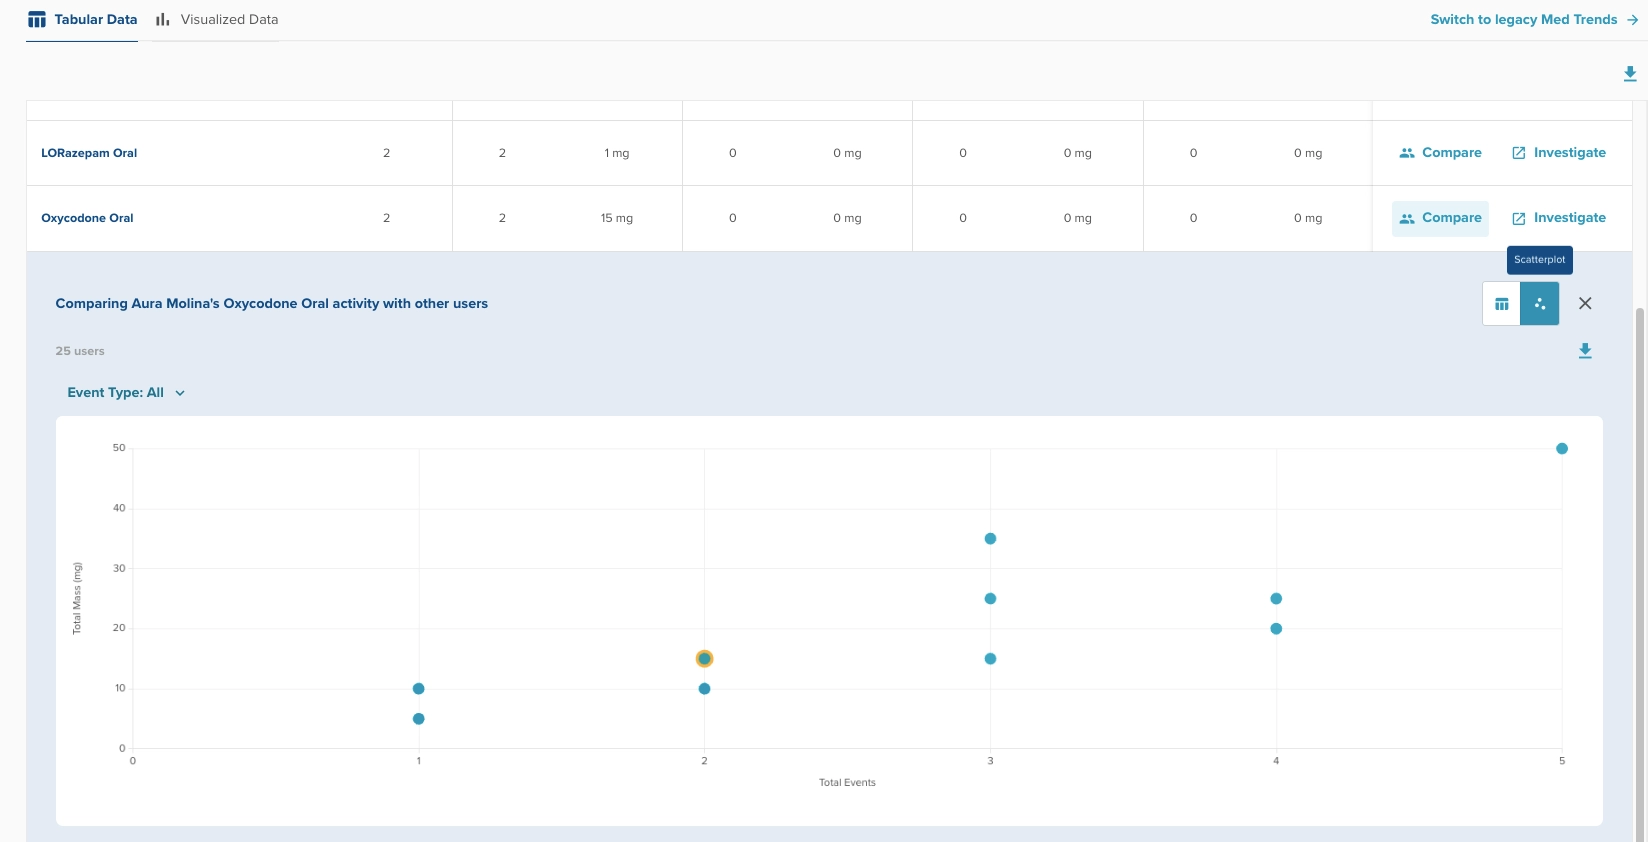
Within this view, you can review the data as both a table or as a scatterplot by selecting the corresponding icon in the top-right corner of the screen.
Click Investigate Data to view all of the relevant medication events from that user; the results will load in a new browser tab.
Compare View
The Compare button allows you to compare the provider's activity for that medication with other users.
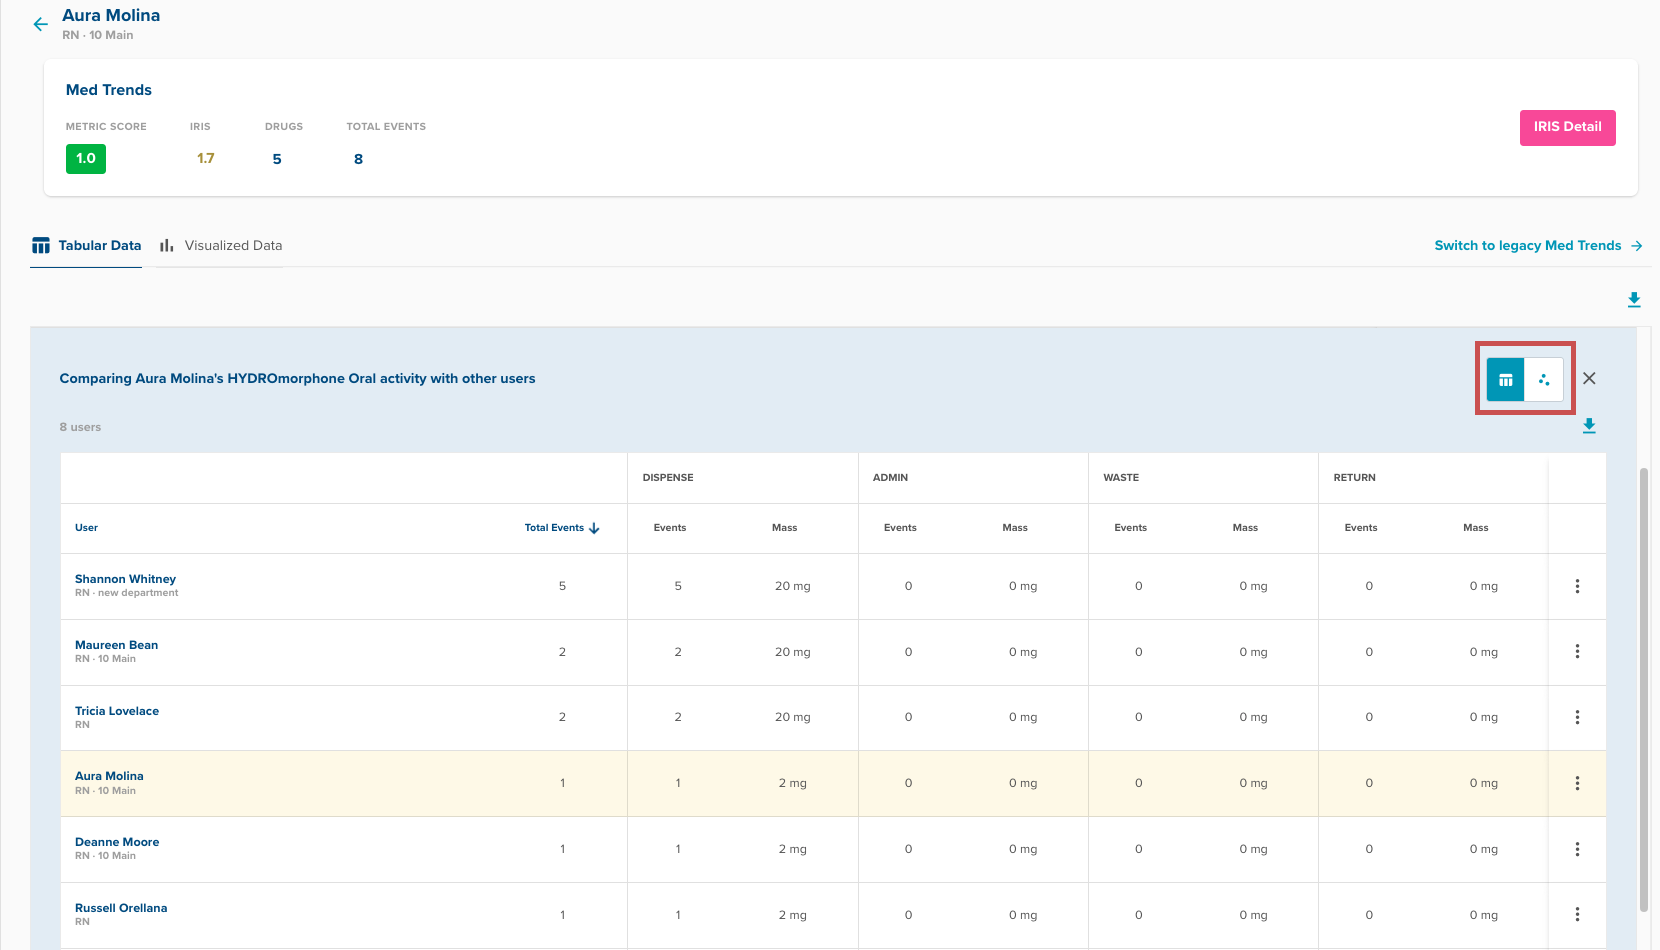
Within this view, you can review the data as both a table or as a scatterplot by selecting the corresponding icon in the top-right corner of the screen.
Investigate Data
The Investigate Data button allows you to to view all of the relevant medication events from that user; the results will load in a new browser tab.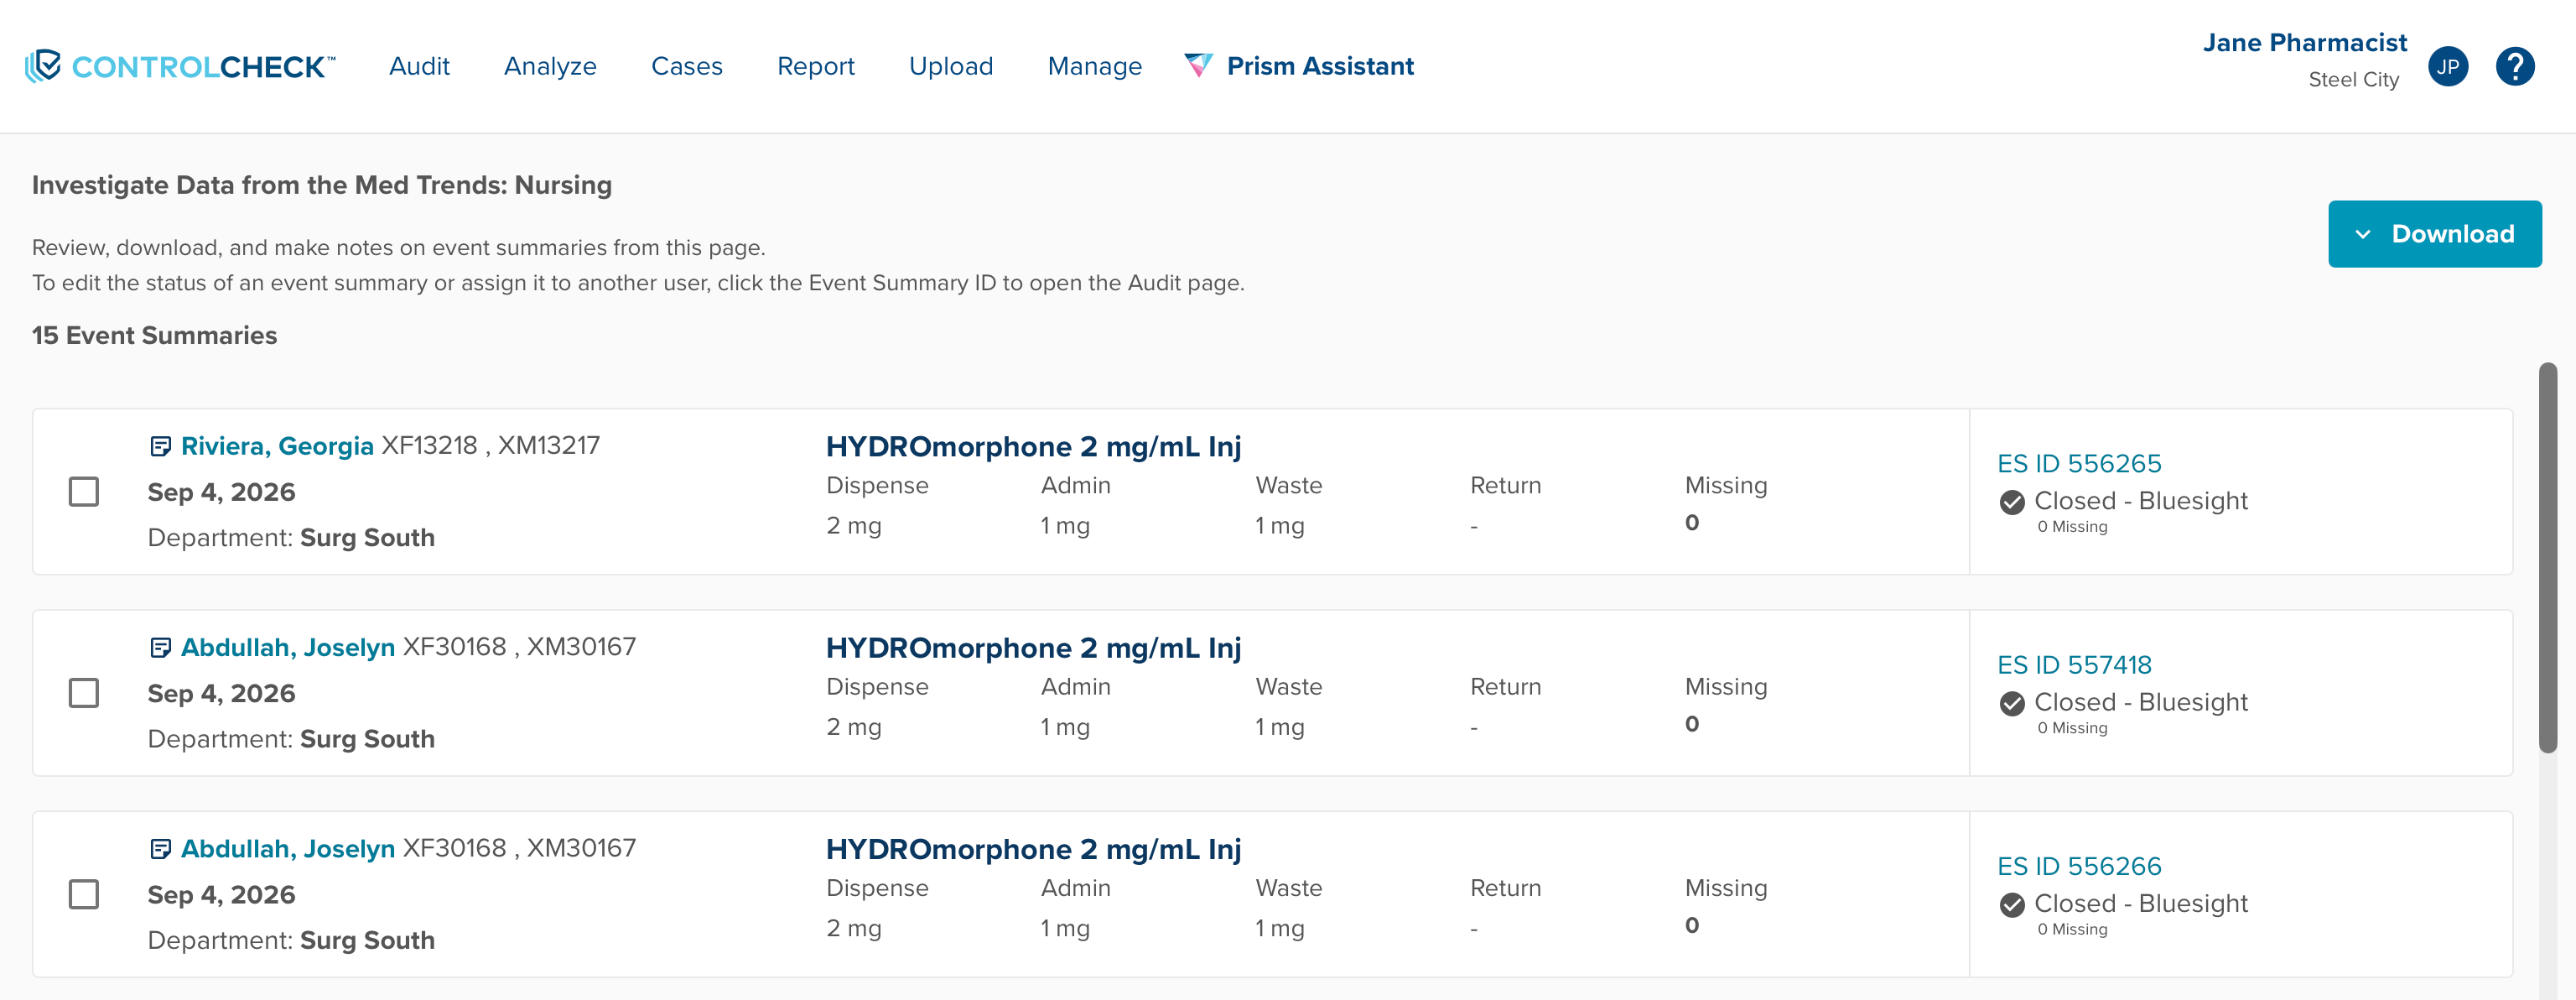
A Note on the Data & Methods
Documentation errors are excluded in the event summary counts in this dashboard. Documentation errors are defined as automatically closed event summaries whose variance is not due to missing or incorrect medication amounts but instead due to a clinician's specific misstep in medication selection: the same medication, different concentrations. A common example of this type of auto-closed documentation error is shown below:
Some facilities may also have documentation errors related to the selection of outpatient versus inpatient identifiers. These are also excluded in the event summary counts in this dashboard. Open variances created within the preceding three days are excluded from the counts in this dashboard.
Any event summaries connected to unmapped identifiers (medication, user), regardless of status or state, are excluded from the counts in this dashboard. Once mapping is completed and the related data is processed, the resulting event summaries will be included in any relevant metrics.
Was this article helpful?
That’s Great!
Thank you for your feedback
Sorry! We couldn't be helpful
Thank you for your feedback
Feedback sent
We appreciate your effort and will try to fix the article